Car trips data log 확인
데이터: https://www.kaggle.com/datasets/vitorrf/cartripsdatamining
1
2
3
4
5
6
7
import numpy as np
import pandas as pd
import matplotlib.pyplot as plt
import seaborn as sns
import sklearn
import warnings
warnings.filterwarnings('ignore')
1
2
3
4
5
6
7
8
9
10
11
12
13
14
15
16
df_list = []

for i in range(10, 15):
    file_name = f'/kaggle/input/cartripsdatamining/Processed Data/fileID{i}_ProcessedTripData.csv'

    df = pd.read_csv(
        file_name,
        header= None,
    )

    df.columns=['Time','Vehicle Speed','SHIFT','Engine Load','Total Acceleration',
            'Engine RPM','Pitch','Lateral Acceleration','Passenger Count',
            'Car Load','AC Status','Window Opening','Radio Volume','Rain Intensity',
            'Visibility','Driver Wellbeing','Driver Rush']

    df_list.append(df)
1
df.head()
| Time | Vehicle Speed | SHIFT | Engine Load | Total Acceleration | Engine RPM | Pitch | Lateral Acceleration | Passenger Count | Car Load | AC Status | Window Opening | Radio Volume | Rain Intensity | Visibility | Driver Wellbeing | Driver Rush | |
|---|---|---|---|---|---|---|---|---|---|---|---|---|---|---|---|---|---|
| 0 | 0.019 | 0.0 | 0 | 0.0 | 0.0 | 0.0 | -0.050212 | -0.0 | 3 | 3 | 0 | 0 | 2 | 0 | 10 | 6 | 2 |
| 1 | 0.026 | 0.0 | 0 | 0.0 | 0.0 | 0.0 | -0.051910 | -0.0 | 3 | 3 | 0 | 0 | 2 | 0 | 10 | 6 | 2 |
| 2 | 0.037 | 0.0 | 0 | 0.0 | 0.0 | 0.0 | -0.053624 | -0.0 | 3 | 3 | 0 | 0 | 2 | 0 | 10 | 6 | 2 |
| 3 | 0.048 | 0.0 | 0 | 0.0 | 0.0 | 0.0 | -0.055352 | -0.0 | 3 | 3 | 0 | 0 | 2 | 0 | 10 | 6 | 2 |
| 4 | 0.056 | 0.0 | 0 | 0.0 | 0.0 | 0.0 | -0.057097 | -0.0 | 3 | 3 | 0 | 0 | 2 | 0 | 10 | 6 | 2 |
1
df.info()
1
2
3
4
5
6
7
8
9
10
11
12
13
14
15
16
17
18
19
20
21
22
23
24
<class 'pandas.core.frame.DataFrame'>
RangeIndex: 118551 entries, 0 to 118550
Data columns (total 17 columns):
 #   Column                Non-Null Count   Dtype
---  ------                --------------   -----
 0   Time                  118551 non-null  float64
 1   Vehicle Speed         118551 non-null  float64
 2   SHIFT                 118551 non-null  int64
 3   Engine Load           118551 non-null  float64
 4   Total Acceleration    118551 non-null  float64
 5   Engine RPM            118551 non-null  float64
 6   Pitch                 118551 non-null  float64
 7   Lateral Acceleration  118551 non-null  float64
 8   Passenger Count       118551 non-null  int64
 9   Car Load              118551 non-null  int64
 10  AC Status             118551 non-null  int64
 11  Window Opening        118551 non-null  int64
 12  Radio Volume          118551 non-null  int64
 13  Rain Intensity        118551 non-null  int64
 14  Visibility            118551 non-null  int64
 15  Driver Wellbeing      118551 non-null  int64
 16  Driver Rush           118551 non-null  int64
dtypes: float64(7), int64(10)
memory usage: 15.4 MB
1
2
3
4
5
6
7
8
9
10
11
12
13
14
15
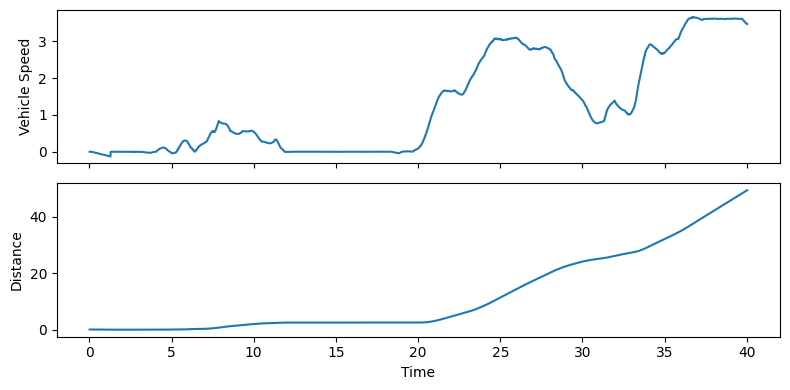
cols = ['Vehicle Speed','SHIFT','Engine Load','Total Acceleration',
'Engine RPM','Pitch','Lateral Acceleration']
fig, axs = plt.subplots(
nrows=len(cols),
figsize=(8, 2*len(cols)),
sharex='col',
sharey='row',
)
for ax, col in zip(axs, cols):
sns.lineplot(df[:2000], x='Time', y=col, ax=ax)
plt.tight_layout()
plt.show()
1
from scipy.integrate import cumtrapz
1
df['Distance'] = cumtrapz(df['Vehicle Speed'], df['Time'], initial=0)
1
2
3
4
5
6
7
8
9
10
11
12
13
14
cols = ['Vehicle Speed','Distance']

fig, axs = plt.subplots(
    nrows=len(cols),
    figsize=(8, 2*len(cols)),
    sharex='col',
    sharey='row',
)

for ax, col in zip(axs, cols):
    sns.lineplot(df[:4000], x='Time', y=col, ax=ax)

plt.tight_layout()
plt.show()
1
2
3
4
5
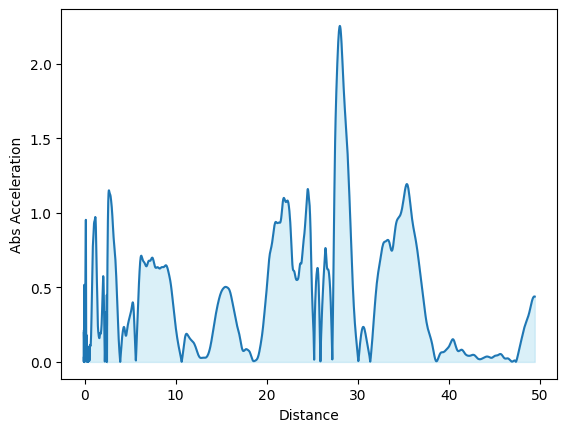
df['Abs Acceleration'] = df['Total Acceleration'].abs()
sns.lineplot(df[:4000], x='Distance', y='Abs Acceleration')
plt.fill_between(df[:4000]['Distance'], df[:4000]['Abs Acceleration'], color='skyblue', alpha=0.3)
plt.show()
1
2
3
4
from scipy.integrate import trapz

work = trapz(df['Abs Acceleration'], df['Distance'])
work
1
5260.302733112259
1
df['Work'] = cumtrapz(df['Abs Acceleration'], df['Distance'], initial=0)
1
2
3
4
5
6
7
8
9
10
def get_dist_col(df):
    df['Distance'] = cumtrapz(df['Vehicle Speed'], df['Time'], initial=0)
    return df

def get_work_col(df, to_abs=True):
    if to_abs:
        df['Work'] = cumtrapz(df['Total Acceleration'].abs(), df['Distance'], initial=0)
    else:
        df['Work'] = cumtrapz(df['Total Acceleration'], df['Distance'], initial=0)
    return df
1
2
df_list = [get_dist_col(df) for df in df_list]
df_list = [get_work_col(df) for df in df_list]
1
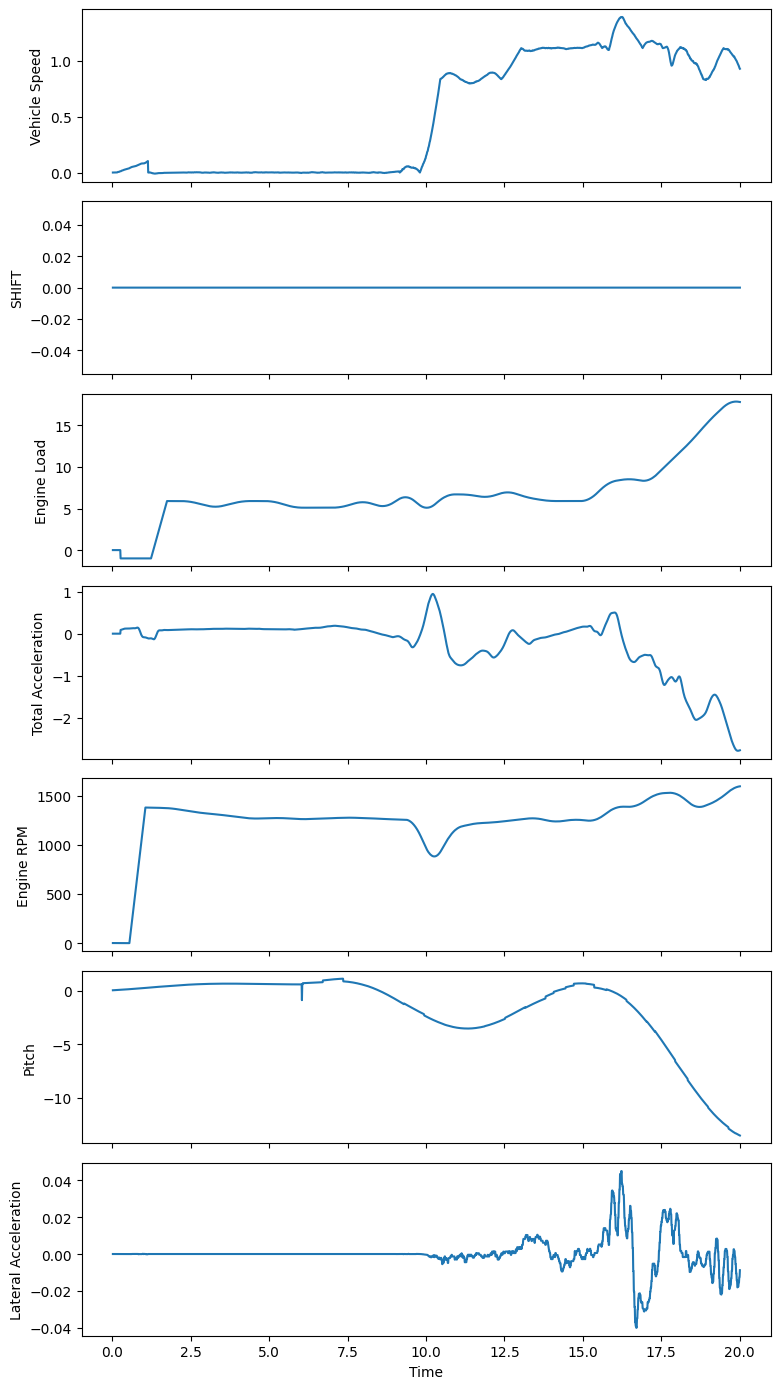
df = df_list[2]
1
2
3
4
5
6
7
8
9
10
11
12
13
14
15
cols = ['Vehicle Speed','SHIFT','Engine Load','Total Acceleration',
            'Engine RPM','Pitch','Lateral Acceleration']

fig, axs = plt.subplots(
    nrows=len(cols),
    figsize=(8, 2*len(cols)),
    sharex='col',
    sharey='row',
)

for ax, col in zip(axs, cols):
    sns.lineplot(df[:2000], x='Time', y=col, ax=ax)

plt.tight_layout()
plt.show()
This post is licensed under CC BY 4.0 by the author.